MLB odds: How to bet on baseball
By Edward Egros
FOX Sports MLB Betting Analyst
Fans enjoying hot dogs and cold brews on a weekday afternoon. The familiar cracking sound of the ball meeting the bat before flying out of sight. Classic pinstripes, lived-in dugouts and 7th-inning stretches.
Baseball is back.
And while enjoying the game from a fan perspective is easy like a Sunday morning double-header, betting on baseball and figuring out which of the thousands of statistics to research can seem overwhelming. So when it comes to putting yourself in the best position to hit your bets out of the park, I've got you covered.
In this piece, I'll go over baseball betting lingo and point you toward the resources you need to find the most important statistics. My goal is to teach you how to bet on individual games. Baseball futures are also a fun way to bet on the sport I love, so we will dive into that as well.
But, first, let’s start with the basics — the moneyline, run line and total over/under.
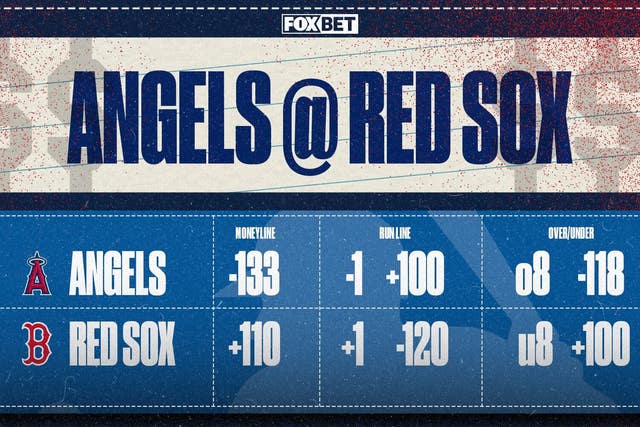
Every game has a display like the one below:

Let's start with the simplest bet you can, the total over/ under. The last column shows the total number of runs expected to be scored in the game. In our example, the total is listed at eight runs. You would then bet on if you think the total runs scored by both teams will be over or under eight runs. Easy, right?
Next, let's break down the moneyline. In its essence, this is a straightforward bet, as you are just picking who you think will win the game. If you pick the winner correctly, you get the payout listed. In the above graphic, the moneyline is the leftmost number.
The number in the middle column of this graphic is called the run line. With this bet, you are basically wagering on how many runs the team will win by. The team with a negative run line is the favorite to win and the team with the positive run line is the underdog. For you to win by picking the favorite based on the run line, that team must win by more than the runs listed. In this instance, the Angels must win by more than one run for you to win your bet.
Next up are payouts. Usually, a negative number means that an outcome is more likely to happen. So that negative number means the implied probability is greater than 50%. In our example, the negative numbers refer to how much you must bet to win $100.
In this instance, if you bet the Boston moneyline, a bet of $100 would pay you out $110. On the flip side, if you took Anaheim -133, you would have to risk $133 to win $100 if the Angels win.
Remember, when there's a plus sign, that means the outcomes are less likely to happen. This is why those teams are usually called the underdogs.
When it comes to the run line, it is a similar concept with risk and payout. If you took Boston +1.0 at -120, you must wager $120 to win $100 if you like the Red Sox run line. If you take Anaheim -1 at +100, you would lay $100 to win $100 if you like the Angels run line.
Those are the ground rules, and like everything else, you will feel more comfortable with repetition and experience. Now comes the next painfully obvious next question: Who should I bet on?
For that, you'll need to stay updated on all my MLB posts on FOX Sports! The other answer is that you'll need a working knowledge of which baseball stats are descriptive and which are predictive. Baseball is a sport where statistics are very valuable. Let's break down how you can use those stats in your favor.
Descriptive stats explain what happened. Mike Trout has a .319 batting average and Max Scherzer has a 2.45 earned run average are examples of descriptive stats. The problem with descriptives is that there is no guarantee that they will accurately predict the future. That's the entire purpose of betting, right! And as interesting as they are, these basic box score numbers are bad indicators for when a player will go on a hot streak, or worse, into a slump.
Predictive statistics do a better job of doing exactly what it sounds like they do — predicting the future. You'll often see the word "expected" alongside these stats. Components of these stats include measurables like exit velocity, the speed of the ball when it’s hit. You might also see launch angle, which is the angle of a ball’s flight after it makes contact with the bat. By looking at how likely a hit occurs with a specific exit velocity and launch angle, these probabilities can be added up to get an expected batting average (XBA). Then, by comparing batting average (BA) to XBA, you can put together a better idea of which hitters are due to get hot and which are due to regress.
Yes, that was a lot. So, to make it even easier, baseballsavant.mlb.com includes these expected statistics in every game preview. The site also includes league-wide information to help with futures bets, like picking a World Series winner.
Speaking of futures, the easiest way to describe it is as a wager placed on an event that will take place in the future. Popular ones as it relates to MLB are bets on teams to win the World Series or which stud player will win MVP.
One key way to make such projections is with run differential. The Pythagorean expectation is a formula that uses runs scored and runs allowed to come up with the winning percentage a ball club should have. A team outperforming their Pythagorean expected record is due for regression, while a team that suffered a lot of bad luck should be poised to perform better the following season. There are other ways to dig even deeper and get more granular.
You can take a look at a ball club's offense and defense and at how many runs should have been scored and allowed, then adjust for strength of schedule (baseball analyst Clay Davenport details all of these adjustments here). Including those adjustments gives you third-order wins and losses. Ball clubs that underperform compared to their third-order records are perhaps primed to succeed going forward. This kind of data gives us the tools we need to make some educated in-season bets.
While there are many more expected statistics and several permutations of predictive statistics out there, applying the latest and greatest often is key to beating the daily and futures markets.
Now comes the fun part. Hopefully, now that you have the basics down, you're well-positioned to throw some cash on a baseball bet or two. But, if you still need more help, I have you covered as well. Stay tuned for my next piece in which I will dig deep into the statistics above to give you my three best MLB futures bets to make now.
And, as always, be sure to head over to FOX Bet to get in on the baseball betting action now!
Edward Egros is a sports analytics broadcaster/writer, a sports betting analyst, a data scientist and an adjunct professor of statistics at Pepperdine University. These passions have led him to become a cold brew aficionado. Edward previously worked in local television, notably at the Fox affiliate in Dallas covering the Rangers, Cowboys and high school football. Follow him on twitter @EdWithSports.
Download the FOX Super 6 app for your chance to win thousands of dollars on the biggest sporting events each and every week! Just make your picks and you could win the grand prize. Download and play today!


